Skip to content

Self-hosted alternatives to Netdata Cloud

Netdata Cloud is the hosted service for Netdata, an open source monitoring agent that collects per-second metrics from servers and applications, with alerts and anomaly detection. One listed app does its main job and runs in your own Cloudflare account.

Each answer comes from the app’s README and source code, compared with the features Netdata Cloud describes on its own site.

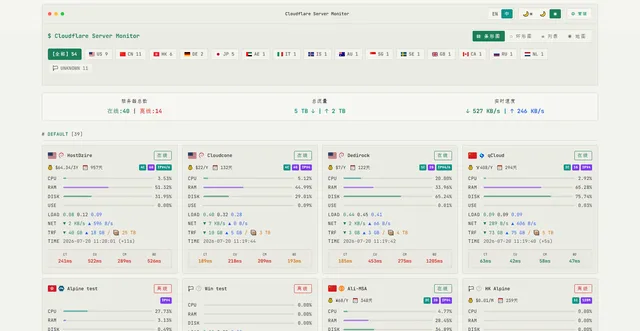
  • CF-Server-Monitor dashboard in light theme (Chinese UI), with per-server CPU, RAM, disk, traffic and latency bars

    Server monitoring with a reporting agent on each machine, a live dashboard, seven-day history and offline alerts

    Deploy
    One-click
    License
    MIT
    GitHub stars
    2.4k stars
    Last commit

Netdata Cloud features, app by app

FeatureCF-Server-Monitor
Agent on each node reporting CPU, memory, disk and network metrics in real timeYes
Per-second metrics collectionPartly
800+ auto-discovered integrations for applications, containers and databasesNo
Dashboards that build themselves from the collected metricsPartly
Machine learning anomaly detection on every metricNo
Alerts with email, Slack, PagerDuty, Teams, webhooks and mobile pushPartly
Long metric retention on the nodesPartly
One view across many nodesYes

Server monitoring with a reporting agent on each machine, a live dashboard, seven-day history and offline alerts

What a Netdata Cloud user would miss
It has no application/container collectors and anomaly detection, and covers per-second collection, generated dashboards, paging integrations and long retention only in part.
What it adds
It also has a report-only agent that can run without root, monthly traffic tracking and server expiry reminders.
  • Yes Agent on each node reporting CPU, memory, disk and network metrics in real time. A Go agent on each server reports CPU, memory, disk, network, load and uptime to the Worker.
  • Partly Per-second metrics collection. Live CPU, memory and network values every 2 seconds by default over WebSocket while a dashboard is open; full metrics every 60 seconds.
  • No 800+ auto-discovered integrations for applications, containers and databases. System metrics only; no application, database or container collectors.
  • Partly Dashboards that build themselves from the collected metrics. Bar, ring, table and map views; no dashboards generated from detected applications.
  • No Machine learning anomaly detection on every metric. Fixed thresholds only; no anomaly detection.
  • Partly Alerts with email, Slack, PagerDuty, Teams, webhooks and mobile push. Offline, resource, monthly traffic and expiry alerts through Telegram, SMTP email, custom webhook and chat apps; no PagerDuty, Slack or Teams presets.
  • Partly Long metric retention on the nodes. History charts go back seven days.
  • Yes One view across many nodes. One dashboard for all servers, and several Workers can be aggregated.

Sources:github.com/huilang-me/CF-Server-Monitor#readmegithub.com/huilang-me/CF-Server-Monitor/blob/main/API.md