CF-Server-Monitor
Server monitoring with a reporting agent on each machine, a live dashboard, seven-day history and offline alerts
CF-Server-Monitor dashboard in light theme (Chinese UI), with per-server CPU, RAM, disk, traffic and latency bars
Agents report CPU, memory, disk, network and latency to a Worker, which stores the data in D1 and pushes live updates to browsers over WebSockets through a Durable Object. CF-Server-Monitor also alerts on resource use, monthly traffic and server expiry dates.
The agent on each monitored machine only reports metrics to the Worker. It has no WebSSH or remote command channel and can run without root. The default agent, cfsm-agent, is written in Go and also ships as a Docker image. The older Shell and PowerShell agents are still available but no longer maintained. The agent runs on mainstream Linux distributions, Alpine, OpenWrt, Synology DSM, fnOS, FreeBSD, macOS and Windows. The dashboard covers CPU, GPU, memory, disk, network, load and uptime, among other metrics, in bar, ring, table and map views. History charts go back seven days, and you can track and correct monthly traffic. Latency and packet loss are measured against configurable ping nodes. In the admin panel you can add, reorder, import and export servers, pick a theme from the theme store, and set up notifications through Telegram, SMTP email, a custom webhook or other built-in channels. A single Worker serves the Vue dashboard from static assets, receives agent reports on /update, writes them to D1 with monthly table rotation and broadcasts live data through a SQLite-backed Durable Object. One cron trigger runs offline and resource alerts every minute; another handles hourly maintenance such as table rotation and expiry checks. API_SECRET serves as both the agent reporting key and the initial admin password. The maintainer recommends a GitHub fork connected to Workers Builds, or GitHub Actions, over the one-click deploy, because those paths make upstream updates easier.
Built for: Developers and small teams running a handful of VPS or home servers who want low-cost, low-maintenance monitoring
What you can use it for
- Watch CPU, memory, disk and traffic across a small VPS fleet
- Get alerts when a server goes offline or crosses a resource threshold
- Track renewal dates for rented servers
- Measure latency and packet loss from each server to chosen ping targets
Deploy
One-click · main path
Branch main
CLI
Branch main
npm install
npm run deploy
npx wrangler secret put API_SECRET
Deploy, then add API_SECRET in the dashboard, change the default admin login, and run the generated agent install command on every server.
What it needs to run
- D1 databasesserver-monitor-db
- Durable ObjectsMetricsBroadcaster
Also uses
- GitHub OAuth (optional): GitHub sign-in for the admin panelSource
Good to know
Each monitored server needs an agent installed. The one-click deploy does not prompt for API_SECRET, so nobody can sign in until you add it. The default ping nodes target the Chinese carriers China Telecom, China Unicom and China Mobile, plus BGP routes. The repository had no license file until September 27, 2026, when the MIT license was added.
Cost on Cloudflare
Depends on usage
Each agent report writes to D1 (100,000 rows written per day on Free) and reaches the Durable Object (100,000 requests and 13,000 GB-s of duration per day on Free). The README sizes the default 60-second report interval at about 60 servers and says a 120-second interval could in theory double that. Larger fleets will need Workers Paid. The app uses two of the five Cron Triggers an account gets on Free.
The estimate is based on Cloudflare’s documented limits and the app’s configuration. What you pay depends on your usage and plan.
Where this comes from
- Repositoryhttps://github.com/huilang-me/CF-Server-Monitor
- App websitehttps://demo.huilang.me/
- Documentationhttps://github.com/huilang-me/CF-Server-Monitor/blob/main/README-en.md
An alternative to Netdata Cloud.
Listing history
- Oct 2, 2026 · CF-Server-Monitor listed
Similar apps
All Uptime & Monitoring apps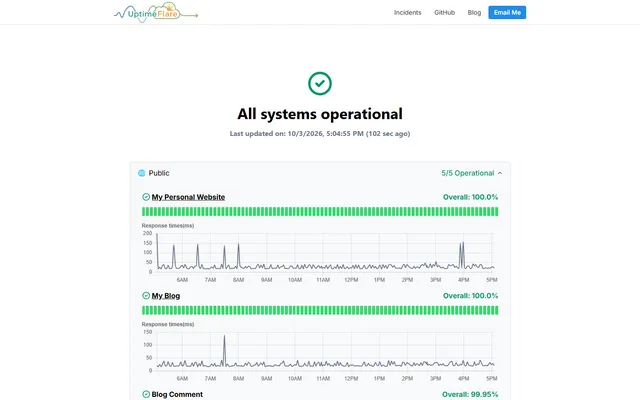
Serverless uptime monitor and status page with HTTP, TCP and keyword checks, deployed through GitHub Actions
- Deploy
- Manual
- License
- Apache-2.0
- GitHub stars
- 3.9k stars
- Last commit
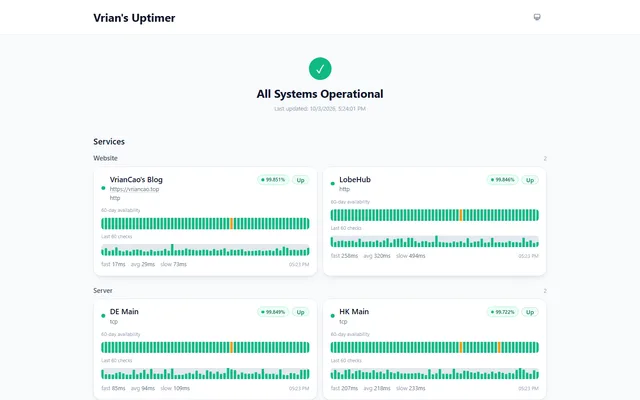
Uptime monitor and status page with HTTP and TCP checks, incidents and webhook alerts, on Workers, Pages and D1
- Deploy
- Manual
- License
- MIT
- GitHub stars
- 481 stars
- Last commit
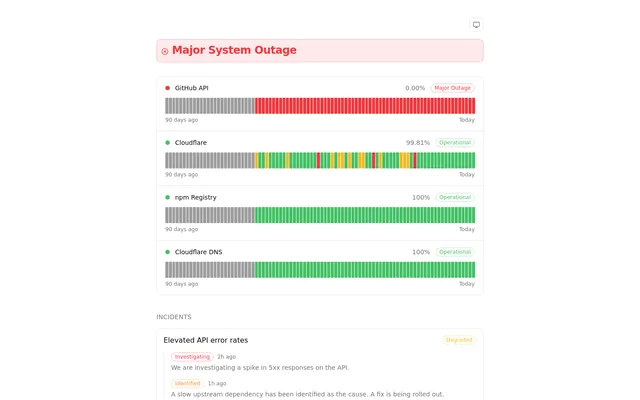
Upptime-style status pages with on-time Cron Trigger checks, D1 uptime history and an edge-cached Astro front end
- Deploy
- CLI
- License
- MIT
- GitHub stars
- 47 stars
- Last commit

