
Uptimer
Uptime monitor and status page with HTTP and TCP checks, incidents and webhook alerts, on Workers, Pages and D1
Uptimer public status page with website and server monitors, 60-day availability bars and latency of the last 60 checks
Uptimer probes websites, APIs and TCP ports as often as once a minute per monitor and sends alerts to Discord, Slack, ntfy or any other webhook. Its public status page shows uptime percentages, latency charts, active incidents and scheduled maintenance. A GitHub Actions workflow in a fork creates the D1 database and deploys the app.
HTTP probes accept custom headers and bodies, allow or deny lists of status codes and ranges, and keyword assertions; TCP probes check that a port accepts connections. Each monitor sets its own check interval and timeout. Global thresholds decide how many failures or successes it takes to change state, which damps flapping. A state machine moves each monitor between UP, DOWN, MAINTENANCE, PAUSED and UNKNOWN. The status page is available in English, Simplified and Traditional Chinese, Japanese and Spanish. The admin dashboard handles incidents with a timeline, maintenance scheduling, notification channels with a test button, and CSV export of uptime and latency analytics. Webhook payloads use templates with variables and can be signed with HMAC-SHA256. Delivery is deduplicated, so each event reaches each channel at most once. On Cloudflare, the Hono API and the probes share one Worker with a cron trigger that fires every minute. Raw check results are kept in D1 for 7 days by default. The React status page and admin dashboard are served from Pages. Syncing the fork with upstream runs the deploy workflow again, which is how updates arrive.
Built for: Developers and small teams who want an uptime monitor and public status page without paying for a hosted service
What you can use it for
- Watch websites and APIs with HTTP checks as often as once a minute
- Check that database or mail ports accept TCP connections
- Publish a public status page with incidents and maintenance windows
- Send down and recovery alerts to Discord, Slack or ntfy
- Export uptime and latency history as CSV
Deploy
Manual
Fork the repository and add CLOUDFLARE_API_TOKEN (Workers, Pages and D1 edit, Account Settings read) and UPTIMER_ADMIN_TOKEN as Actions secrets; the README also recommends CLOUDFLARE_ACCOUNT_ID. Then run the Deploy to Cloudflare workflow, which creates D1, runs the migrations, deploys the Worker and Pages, and stores the admin token as a Worker secret.
Everything runs in GitHub Actions, so nothing has to be installed locally. The README says the first workflow run usually takes about two minutes.
What it needs to run
- D1 databasesuptimer
Good to know
Only HTTP(S) and TCP checks are available, and they run from the Worker's cron trigger; the README documents no choice of check regions. Alerts go out only as webhooks; there is no built-in email or SMS channel. The admin dashboard signs in with one shared admin token.
Cost on Cloudflare
Depends on usage
The README says Uptimer runs on Cloudflare's free or paid tiers. Each check writes to D1, and Workers Free allows 100,000 D1 rows written a day, so many monitors on one-minute intervals may need Workers Paid.
The estimate is based on Cloudflare’s documented limits and the app’s configuration. What you pay depends on your usage and plan.
Where this comes from
- Repositoryhttps://github.com/VrianCao/Uptimer
- App websitehttps://status.vrian.de
- Documentationhttps://github.com/VrianCao/Uptimer/blob/master/docs/deploy-github-actions.md
An alternative to Atlassian Statuspage, Better Stack, Freshping, incident.io Status Pages, Instatus, PagerDuty Status Pages, Status.io, Statuspal, updown.io, UptimeRobot.
Listing history
- Oct 3, 2026 · Uptimer listed
Similar apps
All Uptime & Monitoring apps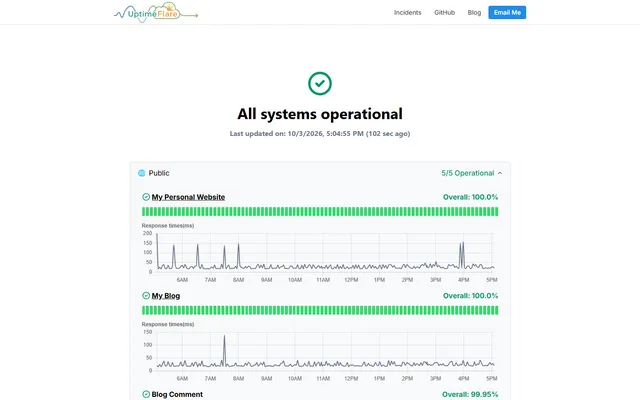
Serverless uptime monitor and status page with HTTP, TCP and keyword checks, deployed through GitHub Actions
- Deploy
- Manual
- License
- Apache-2.0
- GitHub stars
- 3.9k stars
- Last commit
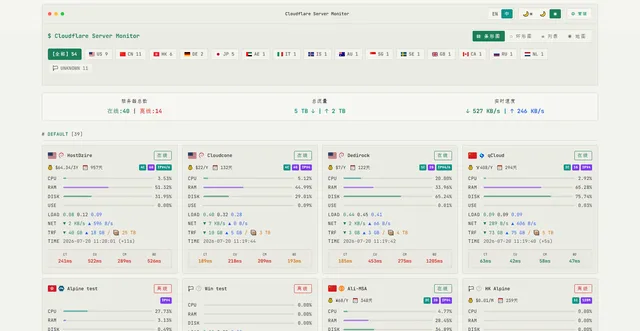
Server monitoring with a reporting agent on each machine, a live dashboard, seven-day history and offline alerts
- Deploy
- One-click
- License
- MIT
- GitHub stars
- 2.4k stars
- Last commit
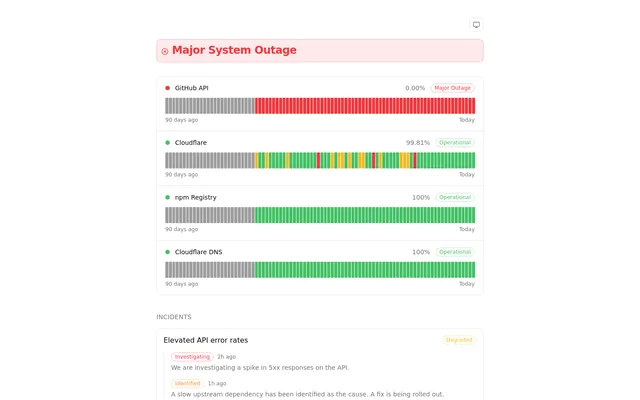
Upptime-style status pages with on-time Cron Trigger checks, D1 uptime history and an edge-cached Astro front end
- Deploy
- CLI
- License
- MIT
- GitHub stars
- 47 stars
- Last commit
