UptimeFlare
Serverless uptime monitor and status page with HTTP, TCP and keyword checks, deployed through GitHub Actions
UptimeFlare status page reporting all systems operational, with daily uptime bars and response-time charts
UptimeFlare checks websites and TCP ports every minute from a cron-triggered Worker and publishes the results on a status page with response-time charts, uptime percentages and incident history. Monitors are defined in a TypeScript config file, and downtime alerts go out through webhooks to services such as Telegram.
HTTP(S) monitors accept custom methods, headers and bodies, and they can require a specific status code or a keyword in the response. History goes back up to 90 days. The status page groups monitors and shows scheduled maintenance notices. It can be served from your own domain through a CNAME, put behind a password for private use, or read as JSON through an API. A single monitor's status can also be embedded in another page as an iframe. The interface ships in English, Chinese, French and German. On Cloudflare, a Worker with a one-minute cron trigger runs the checks and writes results to D1, and a Pages project serves the status page from the same database. A Durable Object acts as a check proxy, so a monitor can run from a chosen Cloudflare region (for example worker://weur) instead of wherever the cron happens to fire. The GitHub Actions workflow uses Terraform to create the D1 database, Worker, cron trigger and Pages project.
Built for: Developers, small teams and homelab owners who want a free uptime monitor and status page without running a server.
What you can use it for
- Publish a status page for a SaaS product or side project
- Check websites, APIs and home servers every minute over HTTP or TCP
- Get a Telegram or webhook alert when a service goes down
- Check whether a service responds from a chosen region such as Western Europe
- Run a password-protected status page for a homelab
Deploy
Manual
Create a repository from the template, add a CLOUDFLARE_API_TOKEN Actions secret (Edit Cloudflare Workers template plus D1 Edit) and edit uptime.config.ts. The GitHub Actions workflow deploys with Terraform on each push.
No local tools are needed, and the README puts setup at under 10 minutes. On a new Cloudflare account, opening the Workers page once creates the workers.dev subdomain the deploy relies on.
What it needs to run
- D1 databasesuptimeflare_d1
Good to know
Monitors live in uptime.config.ts, so adding or changing one means editing the file and redeploying. The README states a ceiling of 50 checks at one-minute intervals. The Apprise notification option needs a separately hosted Apprise server (the wiki deploys one on Vercel). Versions released between September 21, 2025 and March 4, 2026 are affected by CVE-2026-29779, which could expose monitor configuration and credentials in uptime.config.ts to clients; the README advises affected users to upgrade.
Cost on Cloudflare
Likely fits the free plan
The wiki states the Cloudflare free plan is enough and no credit card is required. The deployment uses one cron trigger firing every minute, a D1 database, a SQLite-backed Durable Object and a Pages project, all of which are available on Workers Free.
The estimate is based on Cloudflare’s documented limits and the app’s configuration. What you pay depends on your usage and plan.
Where this comes from
- Repositoryhttps://github.com/lyc8503/UptimeFlare
- Documentationhttps://github.com/lyc8503/UptimeFlare/wiki
- Demohttps://uptimeflare.pages.dev/
An alternative to Atlassian Statuspage, Better Stack, Freshping, Hyperping, Pingdom, updown.io, Uptime.com, UptimeRobot.
Listing history
- Oct 2, 2026 · UptimeFlare listed
Similar apps
All Uptime & Monitoring apps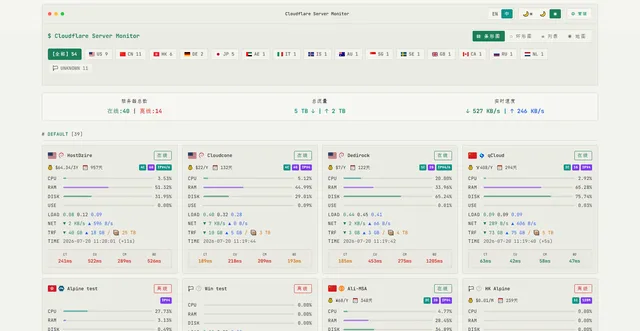
Server monitoring with a reporting agent on each machine, a live dashboard, seven-day history and offline alerts
- Deploy
- One-click
- License
- MIT
- GitHub stars
- 2.4k stars
- Last commit
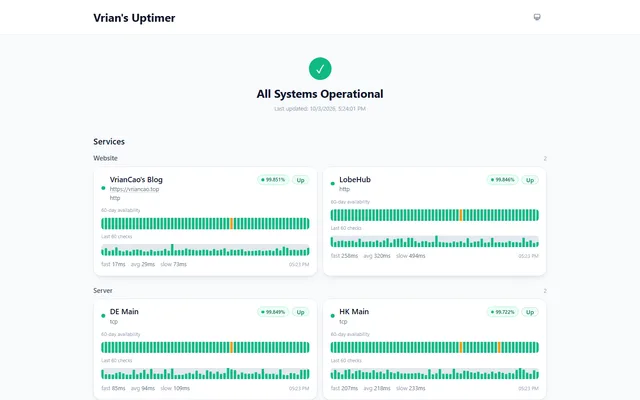
Uptime monitor and status page with HTTP and TCP checks, incidents and webhook alerts, on Workers, Pages and D1
- Deploy
- Manual
- License
- MIT
- GitHub stars
- 481 stars
- Last commit
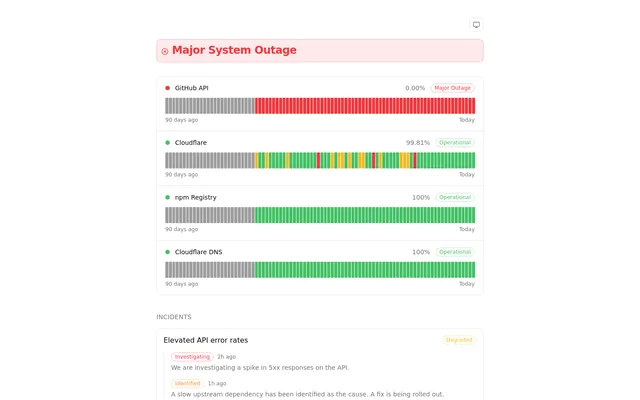
Upptime-style status pages with on-time Cron Trigger checks, D1 uptime history and an edge-cached Astro front end
- Deploy
- CLI
- License
- MIT
- GitHub stars
- 47 stars
- Last commit

