'/%3e%3cg%20fill='none'%20stroke='%23fff'%20stroke-width='24'%20stroke-linecap='round'%3e%3cpath%20d='M%20340%20172%20A%20120%20120%200%200%201%20340%20340'%20opacity='0.4'/%3e%3cpath%20d='M%20310%20202%20A%2076%2076%200%200%201%20310%20310'%20opacity='0.7'/%3e%3cpath%20d='M%20280%20232%20A%2034%2034%200%200%201%20280%20280'/%3e%3c/g%3e%3ccircle%20cx='220'%20cy='256'%20r='36'%20fill='%23fff'/%3e%3cpath%20d='M%20100%20256%20L%20160%20256%20L%20180%20200%20L%20200%20312%20L%20220%20256%20L%20280%20256'%20fill='none'%20stroke='%23fff'%20stroke-width='20'%20stroke-linecap='round'%20stroke-linejoin='round'%20opacity='0.9'/%3e%3c/svg%3e)
Pingflare
Uptime monitor with multi-step API checks and a public status page, built on Workers and D1
Pingflare Edit Monitor screen: a two-step health check script in the visual builder with status and JSON assertions
Every minute, a Cron Trigger runs Pingflare's health checks, writes the results to D1 and feeds a public status page with 90-day uptime bars and incidents. Checks can chain several requests and assert on status codes, response times, JSON paths and headers. Alerts go to Slack, Discord, webhooks or browser push.
You build checks in a visual editor, without writing code. A multi-step check can log in, extract a token and then call an API, with assertions at each step. Severity rules mark a service as degraded or down. The public page at /status groups monitors and carries incident updates. Each monitor has its own alert routing. The installable PWA turns alerts into native push notifications on a phone. The dashboard uses email and password sessions with admin, editor and viewer roles. Pingflare is a SvelteKit app built into one Worker, with Workers Static Assets and a D1 database. The every-minute Cron Trigger authenticates with a CRON_SECRET.
Built for: Small teams and self-hosters who want uptime checks and a status page inside their own Cloudflare account
What you can use it for
- Monitor APIs and websites every minute from Cloudflare's network
- Publish a status page with incident updates for a small service
- Test a login flow end to end with a multi-step script
- Get Slack or Discord alerts when a service degrades or goes down
Deploy
One-click · main path
Branch main
CLI
Branch main
Replace database_id in wrangler.toml with the ID that wrangler d1 create prints before building, as the README's manual setup says.
git clone https://github.com/isala404/pingflare.git
cd pingflare
bun install
bunx wrangler login
bunx wrangler d1 create pingflare-db
bun run build && bun run deploy
openssl rand -hex 32 | bunx wrangler secret put CRON_SECRET
The Deploy button prompts for CRON_SECRET and runs D1 migrations. Then open the Worker URL and create the admin account.
What it needs to run
- D1 databasespingflare-db
Good to know
The repository has 24 commits from one contributor, made between November 18 and December 26, 2025, and none since. On Workers Free, the limit of 50 subrequests per cron invocation caps Pingflare at about 25 monitors. Checks run at most once a minute.
Cost on Cloudflare
Likely fits the free plan
The README says Pingflare works within the Workers Free plan, up to the monitor cap. The every-minute check uses one of the account's 5 Free Cron Triggers, and each run gets 10 ms of CPU. Check results are written to D1, which allows 100,000 rows written per day on Free.
The estimate is based on Cloudflare’s documented limits and the app’s configuration. What you pay depends on your usage and plan.
Where this comes from
- Repositoryhttps://github.com/isala404/pingflare
- App websitehttps://pingflare.tallisa.dev/status
Listing history
- Oct 2, 2026 · Pingflare listed
Similar apps
All Uptime & Monitoring apps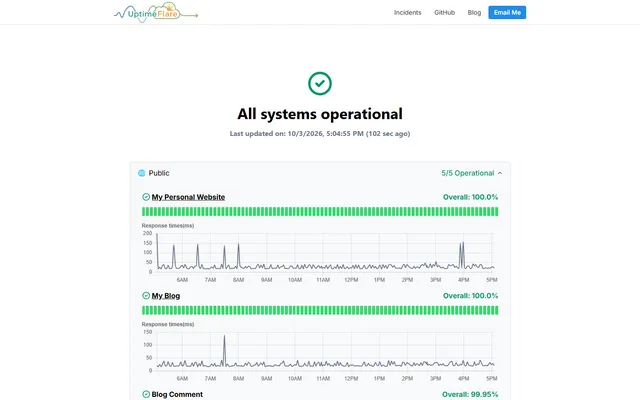
Serverless uptime monitor and status page with HTTP, TCP and keyword checks, deployed through GitHub Actions
- Deploy
- Manual
- License
- Apache-2.0
- GitHub stars
- 3.9k stars
- Last commit
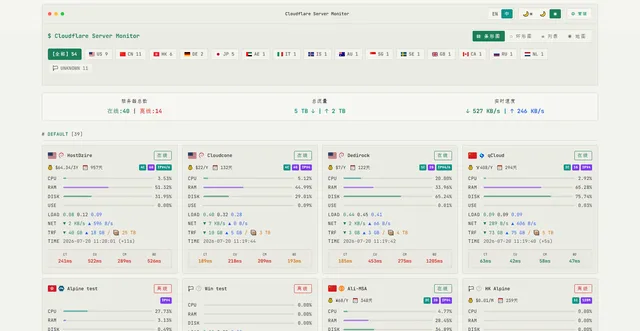
Server monitoring with a reporting agent on each machine, a live dashboard, seven-day history and offline alerts
- Deploy
- One-click
- License
- MIT
- GitHub stars
- 2.4k stars
- Last commit
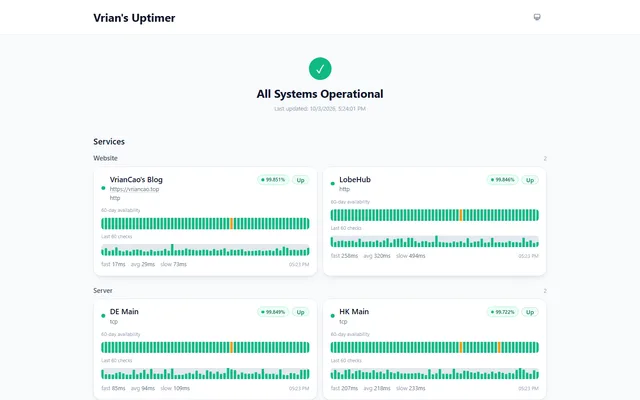
Uptime monitor and status page with HTTP and TCP checks, incidents and webhook alerts, on Workers, Pages and D1
- Deploy
- Manual
- License
- MIT
- GitHub stars
- 481 stars
- Last commit
